Note: This site will shut down at the end of 2026: Due to the dismantling of the US Department of Education, the data collection and reporting functions that the department historically conducted are either being severely impacted or discontinued entirely. While we source and integrate data from a number of sources, the data historically provided by the Department is / was a key component in our compilation process. The data currently on this site will remain available during 2026 but will not be updated.
College Athletics Overview by the Numbers
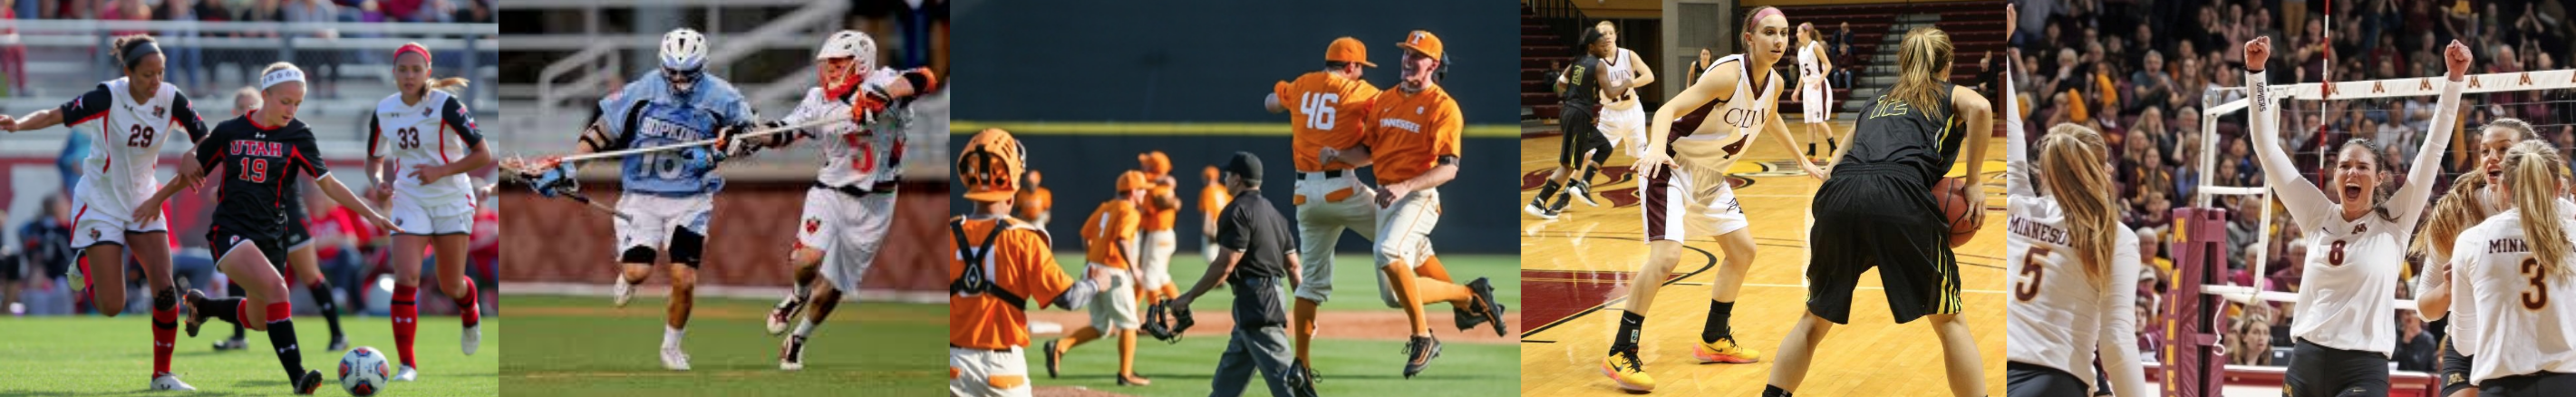
Schools, teams & Participation 2022-23:
By our count about 2,099 post-secondary schools sponsor varsity sports. Basketball is sponsored by the most schools (2,020) followed by Volleyball, Soccer, Baseball & Softball. A few colleges sponsor only one sport while a handful of schools sponsor close to 40 teams. Football is sponsored by less than 900 schools but has the most participants due to its large rosters – an average team size of 109 players. In total, over 650,000 student-athletes will participate in intercollegiate competition on nearly 29,000 teams during the 2022-23 season:
| Varsity Sport | # of Sponsoring Schools | Men's Teams | Women's Teams | Total Teams | Male Athletes | Female Athletes | Total Athletes | Avr Roster Men's Teams | Avr Roster Women's Teams |
||||
|---|---|---|---|---|---|---|---|---|---|---|---|---|---|
| Totals - All Sports | 2,099 | 13,459 | 15,345 | 28,804 | 384,083 | 280,194 | 664,277 | ||||||
| Totals by Sport: | |||||||||||||
| Basketball | 2,020 | 1,983 | 1,950 | 3,933 | 34,230 | 28,821 | 63,051 | 17 | 15 | ||||
| Volleyball | 1,830 | 277 | 1,824 | 2,101 | 4,511 | 29,682 | 34,193 | 16 | 16 | ||||
| Soccer | 1,744 | 1,459 | 1,670 | 3,129 | 44,259 | 44,046 | 88,305 | 30 | 26 | ||||
| Baseball | 1,709 | 1,707 | - | 1,707 | 64,052 | - | 64,052 | 38 | - | ||||
| Softball | 1,701 | - | 1,697 | 1,697 | - | 34,889 | 34,889 | - | 21 | ||||
| Cross Country | 1,610 | 1,508 | 1,598 | 3,106 | 19,628 | 19,305 | 38,933 | 13 | 12 | ||||
| Track & Field | 1,353 | 1,239 | 1,345 | 2,584 | 38,516 | 37,268 | 75,784 | 31 | 28 | ||||
| Golf | 1,319 | 1,227 | 1,047 | 2,274 | 11,990 | 7,853 | 19,843 | 10 | 8 | ||||
| Tennis | 1,114 | 908 | 1,092 | 2,000 | 9,408 | 10,314 | 19,722 | 10 | 9 | ||||
| Football | 893 | 891 | - | 891 | 97,300 | - | 97,300 | 109 | - | ||||
| Swimming & Diving | 687 | 558 | 678 | 1,236 | 11,635 | 15,136 | 26,771 | 21 | 22 | ||||
| Lacrosse | 645 | 463 | 594 | 1,057 | 17,977 | 14,832 | 32,809 | 39 | 25 | ||||
| Wrestling | 436 | 431 | 135 | 566 | 12,377 | 2,052 | 14,429 | 29 | 15 | ||||
| Field Hockey | 288 | - | 287 | 287 | - | 6,630 | 6,630 | - | 23 | ||||
| Bowling | 219 | 123 | 217 | 340 | 1,446 | 2,107 | 3,553 | 12 | 10 | ||||
| Hockey | 189 | 185 | 131 | 316 | 5,586 | 3,255 | 8,841 | 30 | 25 | ||||
| Beach Volleyball | 179 | 4 | 179 | 183 | 76 | 2,802 | 2,878 | 19 | 16 | ||||
| Rowing | 152 | 73 | 151 | 224 | 2,920 | 7,488 | 10,408 | 40 | 50 | ||||
| Water Polo | 125 | 92 | 115 | 207 | 1,901 | 2,053 | 3,954 | 21 | 18 | ||||
| Gymnastics | 87 | 15 | 85 | 100 | 322 | 1,789 | 2,111 | 21 | 21 | ||||
| Equestrian | 77 | 77 | 77 | - | 2,071 | 2,071 | - | 27 | |||||
| Rodeo | 72 | 72 | 72 | 144 | 1,257 | 1,017 | 2,274 | 17 | 14 | ||||
| Rugby | 58 | 35 | 43 | 78 | 1,252 | 1,257 | 2,509 | 36 | 29 | ||||
| Acrobatics | 48 | - | 48 | 48 | - | 1,314 | 1,314 | - | 27 | ||||
| Fencing | 46 | 36 | 45 | 81 | 689 | 765 | 1,454 | 19 | 17 | ||||
| Skiing | 41 | 39 | 40 | 79 | 485 | 459 | 944 | 12 | 11 | ||||
| Stunt | 40 | - | 40 | 40 | - | 1,044 | 1,044 | - | 26 | ||||
| Triathlon | 40 | 4 | 40 | 44 | 15 | 294 | 309 | 4 | 7 | ||||
| Squash | 37 | 33 | 32 | 65 | 500 | 428 | 928 | 15 | 13 | ||||
| Sailing | 33 | 31 | 33 | 64 | 583 | 379 | 962 | 19 | 11 | ||||
| Rifle | 29 | 24 | 29 | 53 | 111 | 209 | 320 | 5 | 7 | ||||
| Archery | 27 | 25 | 26 | 51 | 207 | 218 | 425 | 8 | 8 | ||||
| Flag Football | 25 | - | 25 | 25 | - | 417 | 417 | - | 17 | ||||
| Sprint Football | 17 | 17 | - | 17 | 850 | - | 850 | 50 | - | ||||
Other Sports | ** | ||||||||||||
| Totals - All Sports | 2,099 | 13,459 | 15,345 | 28,804 | 384,083 | 280,194 | 664,277 | ||||||
Participation by Athletic Association:
With the exception of a handful of independent programs, virtually all schools belong to an athletic association. There are a number of schools with dual memberships based on their sport mix so consequently there is no singular number available of unique members for each association. Here’s how association membership breaks out for basketball:
| Association / Division | # of Schools | % of Schools |
||
|---|---|---|---|---|
| NCAA I | 364 | 18.0% | ||
| NCAA II | 299 | 14.8% | ||
| NCAA III | 438 | 21.7% | ||
| Totals - NCAA | 1,101 | 54.5% | ||
| NJCAA | 437 | 21.6% | ||
| NAIA | 232 | 11.5% | ||
| CCCAA | 104 | 5.1% | ||
| USCAA | 58 | 2.9% | ||
| NCCAA | 46 | 2.3% | ||
| NWAC | 34 | 1.7% | ||
| Independent | 8 | 0.4% | ||
| Totals | 2,020 | 100.0% | ||
About 54% of schools that sponsor varsity sports are NCAA members, but since NCAA schools in general offer more and larger sports programs, around 78% of all college athletes compete within NCAA sanctioned competition.
Athletic Participation by Gender:
With few exceptions, virtually all schools sponsoring intercollegiate sports must meet Title IX mandates which require equal participation opportunities for male and female students. While there is no actual Title IX “quota”, for college athletics as a whole, the percentage of male and female athletes is virtually 50/50 after excluding football:
| Athletic Participation by Gender | Male | Female | Total | |||
|---|---|---|---|---|---|---|
| Total athletes | 384,083 | 280,194 | 664,277 | |||
| Less Football | (97,300) | (97,300) | ||||
| Equals Non-football Athletes | 286,783 | 280,194 | 566,977 | |||
| % of non-football athletes | 50.6% | 49.4% | 100.0% | |||
Why exclude football? While female athletes are eligible to participate in college football, by its nature it’s an overwhelming male sport with huge rosters. And unlike say the relationship of baseball and softball, there is no equivalent female counterpart sport to football. So in terms of raw data, football throws a pretty big monkey wrench into athletic participation numbers.
However the objective of Title IX is to provide equal participation opportunities to both male and female students, and college athletic departments nationwide have actually done an excellent job here – nearly 50% of all (non-football) college athletes and nearly 43% of all college athletes nationwide are female. As a comparison, these percentages are over double the percentage of females graduating with computer science (20%) or engineering degrees (22%) – both of these departments are also subject to Title IX compliance.
International Student-Athlete Participation:
International student-athletes make up a material percentage of participants in all associations and divisions. The following International participation percentages for NCAA Division I and II schools are reported in the NCAA December 2022 rends report:
| % of International Athletes by NCAA Sport 2022: | NCAA I Men | NCAA I Women | NCAA II Men | NCAA II Women |
|
|---|---|---|---|---|---|
| Tennis | 61% | 66% | 55% | 48% | |
| Ice Hockey | 39% | 47% | 4% | n/a | |
| Soccer | 37% | 11% | 22% | 7% | |
| Field Hockey | - | 29% | - | 9% | |
| Golf | 26% | 40% | 25% | 21% | |
| Water Polo | 21% | 21% | n/a | 3% | |
| Basketball | 16% | 14% | 8% | 5% | |
| Swimming & Diving | 14% | 14% | 15% | 12% | |
| Track & Field | 9% | 11% | 4% | 4% | |
| Cross Country | 8% | 11% | 2% | <1% | |
| Volleyball | 7% | 10% | 11% | 2% | |
| Lacrosse | 7% | 2% | 7% | 3% | |
| Baseball | 2% | - | 1% | - | |
| Softball | - | < 1% | - | 1% | |
| Football | 2% | - | 1% | - | |
| Wrestling | < 1% | - | 1% | - | |
International student-athlete participation data was reported only for NCAA Division I and II schools. The international participation percentage is significantly lower for almost all NCAA Division III, NAIA and NJCAA schools.
Varsity v Club status
We report data strictly on varsity level collegiate athletic programs, virtually all of which compete within and are subject to rules of each School’s respective athletic association. It is estimated that in excess of one million post secondary students athletes also compete in college club and intramural sports programs, the data presented on this site does not include these sports or participants.