NCAA I Basketball Players by Height:
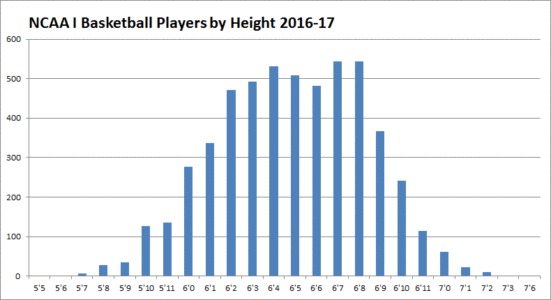
The characteristic most commonly attributed to basketball players is height, and lets face it, basketball players tend to be on the taller side. But how tall? We crunched the numbers on all players listed on NCAA I men’s team rosters for the 2016-17 season and here’s what we came up with. And for statistical nerds like us, we were elated to find the data resulted in a near perfect bell curve:

In total we compiled data on 5,341 players from 351 men’s teams competing at the NCAA I division level. The average height was just under 6’5 and the most common listed height was 6’7 with a range from a 5’5 (All Conference!) guard to a 7’6 center.
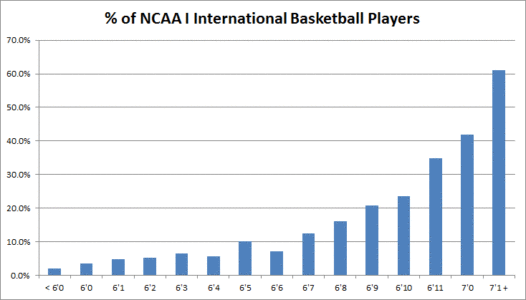
International players now make up about 15% of NCAA I men’s basketball rosters, but account for a disproportionately higher percentage of players 6’9 and above, and nearly half of all players 7′ or above. On the reverse side, NCAA I athletes from overseas account for a disproportionately smaller percentage of players 6’6 and shorter:

While the most common listed height for all NCAA I players was 6’7, the most common listed height for US born players was 6’4 and the most common listed height for international players was significantly higher at 6’8.
It’s important to note these are listed heights, and there is a fair amount of “stature inflation” going around these days. While a doctor may measure your height barefoot, basketball heights these days appear to most often include shoes for high school & college players.
Odds of Playing NCAA I Basketball by State:
The odds of making a D1 roster vary significantly depending on where you compete in High School. The odds are much higher if you are from basketball hotbeds such as Washington DC (33:1) and Maryland (35:1) , not so good if you’re from some other states where the odds of playing D1 may be over 500:1 Here is the summary of our 2018 analysis:
| District of Columbia | 1,045 | 32 | 33:1 | |||
| Maryland | 5,650 | 162 | 35:1 | |||
| North Carolina | 11,063 | 231 | 48:1 | |||
| Virginia | 9,387 | 164 | 57:1 | |||
| Georgia | 13,021 | 225 | 58:1 | |||
| Louisiana | 7,890 | 121 | 65:1 | |||
| Tennessee | 9,034 | 124 | 73:1 | |||
| Indiana | 11,111 | 143 | 78:1 | |||
| New York | 20,078 | 246 | 82:1 | |||
| Florida | 22,262 | 250 | 89:1 | |||
| Illinois | 24,244 | 272 | 89:1 | |||
| South Carolina | 6,720 | 71 | 95:1 | |||
| Nevada | 3,057 | 32 | 96:1 | |||
| Arkansas | 5,446 | 54 | 101:1 | |||
| Utah | 3,883 | 37 | 105:1 | |||
| Kentucky | 7,061 | 66 | 107:1 | |||
| New Jersey | 15,365 | 143 | 107:1 | |||
| Ohio | 23,111 | 193 | 120:1 | |||
| California | 47,584 | 384 | 124:1 | |||
| Delaware | 1,775 | 14 | 127:1 | |||
| West Virginia | 3,140 | 24 | 131:1 | |||
| Mississippi | 8,720 | 66 | 132:1 | |||
| Connecticut | 5,374 | 40 | 134:1 | |||
| Pennsylvania | 21,660 | 150 | 144:1 | |||
| Arizona | 8,551 | 55 | 155:1 | |||
| Alabama | 13,698 | 87 | 157:1 | |||
| Colorado | 9,204 | 58 | 159:1 | |||
| Texas | 65,977 | 408 | 162:1 | |||
| Washington | 12,023 | 74 | 162:1 | |||
| Michigan | 21,367 | 122 | 175:1 | |||
| Missouri | 14,313 | 79 | 181:1 | |||
| Kansas | 8,829 | 46 | 192:1 | |||
| Vermont | 823 | 4 | 206:1 | |||
| Oregon | 7,620 | 37 | 206:1 | |||
| New Hampshire | 2,542 | 12 | 212:1 | |||
| New Mexico | 4,111 | 19 | 216:1 | |||
| Wisconsin | 14,343 | 66 | 217:1 | |||
| Montana | 3,410 | 15 | 227:1 | |||
| Idaho | 3,824 | 16 | 239:1 | |||
| Minnesota | 13,847 | 56 | 247:1 | |||
| Oklahoma | 10,093 | 40 | 252:1 | |||
| Massachusetts | 12,763 | 49 | 260:1 | |||
| Rhode Island | 1,847 | 6 | 308:1 | |||
| Iowa | 11,441 | 36 | 318:1 | |||
| Nebraska | 7,208 | 22 | 328:1 | |||
| Hawaii | 1,727 | 4 | 432:1 | |||
| Alaska | 2,258 | 4 | 565:1 | |||
| Maine | 3,536 | 6 | 589:1 | |||
| South Dakota | 3,567 | 6 | 595:1 | |||
| Wyoming | 1,793 | 3 | 598:1 | |||
| North Dakota | 2,977 | 3 | 992:1 | |||
So do hotbeds really matter? In the end a talented and motivated high school player should land on a college team no matter where he or she plays in high school. However since scouts and recruiters typically spend more time watching games in hotbed areas than in non-hotbed areas, a player in a hotbed area will likely have greater exposure to college recruiters. It’s not uncommon that a college scout goes to watch a prospect play and comes away impressed by a different player who happened to be playing in the same game.
NCAA Men’s Basketball Demographics:
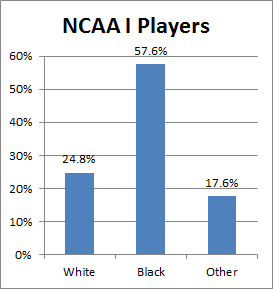
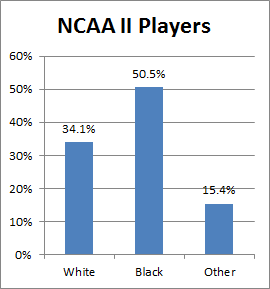
The NCAA maintains and publishes reports on racial make-up of participants within its divisions. The following graphs and tables were compiled from the NCAA reporting for the 2015-16 season for the three Men’s basketball divisions. “Other” includes other races, players listing two or more races, some international players and unclassified players:
 |  |  |
There is some correlation between the racial make-up of players and the odds of playing NCAA I by state above. However there are a myriad of other factors involved, including the fact that some sports are just more popular in some states than others. For example Massachusetts produces a disproportionately higher percentage of lacrosse players than it does in basketball. Minnesota is towards the bottom of our basketball hotbed listing but is hands down the US hotbed for producing NCAA I hockey players.

